
The HistoBar series displays Candlesticks with a vertical Histogram on the side or on both sides. The vertical histogram represents the price volume of the corresponding candlestick. This series is provided by the FastHistoBarRenderableSeries type, which accepts data from an OhlcDataSeries and included CandlestickMetaData instances (Date, Open, High, Low, Close, Metadata). Each metadata instance contains a collection of ITick objects, providing the necessary data for a vertical histogram associated with a candlestick.
Examples for the OHLC Series can be found in the SciChart WPF Examples Suite which can be downloaded from the SciChart Website or our SciChart.WPF.Examples Github Repository.

To declare a FastHistoBarRenderableSeries, use the following code:
| Declare a FastHistoBarRenderableSeries in XAML |
Copy Code |
|---|---|
<s:SciChartSurface> <s:SciChartSurface.RenderableSeries> <s:FastHistoBarRenderableSeries x:Name="rSeries" MaxHistoBarCandles="30" TickSize="0.5" DataPointWidth="0.8" StrokeThickness="1" StrokeDown="#D0E26565" StrokeUp="#7052CC54" FillDown="#D0E26565" FillUp="#7052CC54"/> </s:SciChartSurface.RenderableSeries> <s:SciChartSurface.XAxis> <s:IndexDateTimeAxis/> </s:SciChartSurface.XAxis> <s:SciChartSurface.YAxis> <s:NumericAxis/> </s:SciChartSurface.YAxis> </s:SciChartSurface> | |
| Declare a FastHistoBarRenderableSeries in XAML - Code-Behind part |
Copy Code |
|---|---|
// Code Behind, create the ITick inherited class public class CandleTick : ITick { public double Price { get; set; } public DateTime TimeStamp { get; set; } public BidOrAsk BidOrAsk { get; set; } public long Volume { get; set; } } // Code Behind, e.g. in OnLoaded event handler, set the DataSeries var ohlcDataSeries = new OhlcDataSeries<DateTime, double>(); // FastHistoBarRenderableSeries expects data in the format // Date, Open, High, Low, Close, CandlestickMetaData var barMetadata = new CandlestickMetaData(); barMetadata.AddTick(new CandleTick { BidOrAsk = BidOrAsk.Bid, Price = 6061.60, Volume = 26441, TimeStamp = new DateTime(2015, 10, 01) }); // ... Adding more CandleTicks to barMetadata ohlcDataSeries.Append(new DateTime(2015, 10, 01), 6061.60, 6172.80, 6053.30, 6072.50, barMetadata); // ... Appending more Date/OHLC/Metadata to ohlcDataSeries rSeries.DataSeries = ohlcDataSeries; | |
| Declare a FastHistoBarRenderableSeries in Code-Behind |
Copy Code |
|---|---|
// Create the ITick inherited class public class CandleTick : ITick { public double Price { get; set; } public DateTime TimeStamp { get; set; } public BidOrAsk BidOrAsk { get; set; } public long Volume { get; set; } } // Declare the SciChartSurface var sciChartSurface = new SciChartSurface(); sciChartSurface.XAxis = new IndexDateTimeAxis(); sciChartSurface.YAxis = new NumericAxis(); // ... // Declare and add a FastHistoBarRenderableSeries var histobarSeries = new FastHistoBarRenderableSeries() { MaxHistoBarCandles = 30, TickSize = 0.5, DataPointWidth = 0.8, StrokeThickness = 1, StrokeDown = Color.FromArgb(208, 226, 101, 101)), StrokeUp = Color.FromArgb(112, 82, 204, 84)), FillDown = new SolidColorBrush(Color.FromArgb(208, 226, 101, 101)), FillUp = new SolidColorBrush(Color.FromArgb(112, 82, 204, 84)) }; sciChartSurface.RenderableSeries.Add(histobarSeries); // FastHistoBarRenderableSeries expects data in the format // Date, Open, High, Low, Close, CandlestickMetaData var ohlcDataSeries = new OhlcDataSeries<DateTime, double>(); var barMetadata = new CandlestickMetaData(); barMetadata.AddTick(new CandleTick { BidOrAsk = BidOrAsk.Bid, Price = 6061.60, Volume = 26441, TimeStamp = new DateTime(2015, 10, 1) }); // ... Adding more CandleTicks to barMetadata ohlcDataSeries.Append(new DateTime(2015, 10, 1), 6061.60, 6172.80, 6053.30, 6072.50, barMetadata); // ... Appending more Date/OHLC/Metadata to ohlcDataSeries histobarSeries.DataSeries = ohlcDataSeries; | |
Controlling the display of Histogram Bars
By default, FastHistoBarRenderableSeries displays data as Candlesticks without histogram bars. The display of histogram bars is determined by the MaxHistoBarCandles property. This property defines the maximum number of candlesticks in the viewport which will appear with histogram bars. For example, if the MaxHistoBarCandles is set to 10, histogram bars will appear when there are between 1 and 10 candlesticks in the viewport. If an 11th candlestick enters the viewport, the histogram bars will no longer be shown.
Showing or Hiding the Candlesticks
When histograms are displayed, you can control the visibility of candlesticks next to them using the ShowCandlesticks property. Note that this property only controls the visibility of the histogram candles and does not affect the main candles of the series.
| Showing or Hiding the Candlestick |
Copy Code |
|---|---|
<s:FastHistoBarRenderableSeries ShowCandlesticks="True"/> | |
Setting the Histogram Mode
The FastHistoBarRenderableSeries supports three visualization modes, which determine how the histogram will appear. The following options are available:
CumulativeVolume – Aggregates tick volumes per bar to show net buying or selling pressure over the bar’s lifespan.
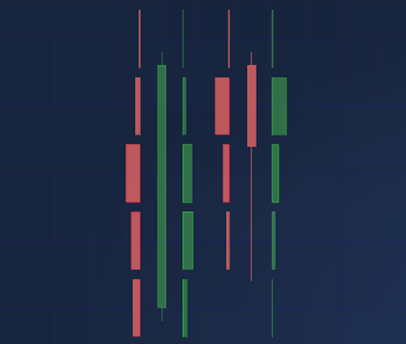
MarketProfile (default) – Highlights where trading activity was concentrated inside each bar, offering a micro-profile view.

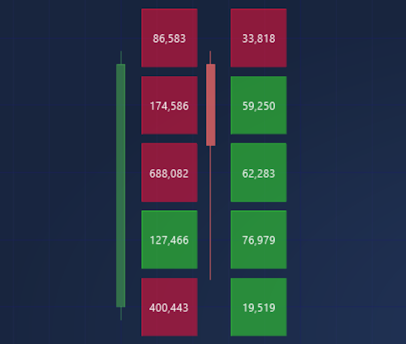
VolumeLadder – Displays volume distributed vertically across individual price levels within each candlestick, separated into buy (green) and sell (red) volumes.
You can change the histogram mode by using the HistogramMode property.
| Setting the histogram mode |
Copy Code |
|---|---|
<s:FastHistoBarRenderableSeries HistogramMode="MarketProfile"/> | |
Setting the Horizontal and Vertical Histogram Spacing
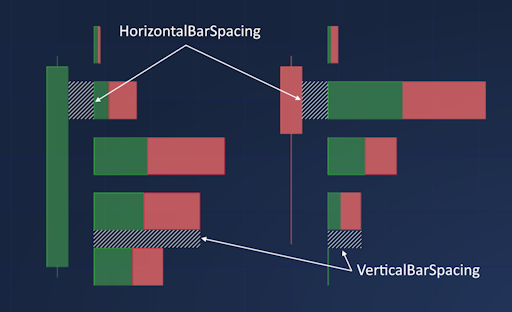
The histogram spacing can be adjusted by using the HorizontalBarSpacing and VerticalBarSpacing properties. The horizontal bar spacing specifies the distance between the candlestick and its corresponding histogram, whereas the vertical bar spacing defines the separation between individual histogram bars.
| Setting the histogram spacing |
Copy Code |
|---|---|
<s:FastHistoBarRenderableSeries HorizontalBarSpacing="30" VerticalBarSpacing="20"/> | |
Setting the Stroke and Fill for the Candlestick
The FastHistoBarRenderableSeries provides the StrokeDown, FillDown, StrokeUp and FillUp properties, which can be used to specify the Stroke color and Fill brush for the candlesticks depending on the actual OHLC values. If the Close value is equal to or greater than the Open value, the candlestick will be rendered using the Up properties, otherwise – using the Down properties. You can also specify the stroke thickness of the candlestick border using the StrokeThickness property.
| Setting the Stroke color and Fill brush |
Copy Code |
|---|---|
<s:FastHistoBarRenderableSeries StrokeThickness="2" StrokeDown="#D0E26565" StrokeUp="#7052CC54" FillDown="#D0E26565" FillUp="#7052CC54"/> | |
Customizing the Histogram Bars
To customize the appearance of histogram bars, you can apply histogram bar styles using the AskBarStyle and BidBarStyle properties. These styles allow you to adjust the Fill, Stroke, StrokeThickness, Foreground, FontSize and TextFormatting properties of histogram bars. The Ask or Bid style is selected based on the ITick.BirOrAsk value of each histogaram bar.
| Setting histogram bar styles |
Copy Code |
|---|---|
<s:FastHistoBarRenderableSeries StrokeThickness="2" StrokeDown="#D0E26565" StrokeUp="#7052CC54" FillDown="#D0E26565" FillUp="#7052CC54"> <s:FastHistoBarRenderableSeries.AskBarStyle> <Style TargetType="s:HistogramBar"> <Setter Property="StrokeThickness" Value="2"/> <Setter Property="Stroke" Value="#32CD32"/> <Setter Property="Fill" Value="#002800"/> <Setter Property="Foreground" Value="#FFFFFF"/> <Setter Property="TextFormatting" Value="N2"/> </Style> </s:FastHistoBarRenderableSeries.AskBarStyle> <s:FastHistoBarRenderableSeries.BidBarStyle> <Style TargetType="s:HistogramBar"> <Setter Property="StrokeThickness" Value="2"/> <Setter Property="Stroke" Value="#DC143C"/> <Setter Property="Fill" Value="#2A0000"/> <Setter Property="Foreground" Value="#FFFFFF"/> <Setter Property="TextFormatting" Value="N2"/> </Style> </s:FastHistoBarRenderableSeries.BidBarStyle> </s:FastHistoBarRenderableSeries> | |
Controlling the Price Levels and Ticks aggregation
The FastHistoBarRenderableSeries uses a sealed MarketProfileSeriesHelper class designed to assist with aggregating market profile data and calculating price levels for histogram bars. The MarketProfileSeriesHelper instance is automatically created with the series, but you can assign your instance of this helper class using the MarketProfileSeriesHelper property. This can be useful when you need to share a single MarketProfileSeriesHelper instance between multiple series or when using the MVVM API to access the helper from a view-model.
The MarketProfileSeriesHelper provides the TickSize property for controlling the price levels calculation and tick aggregation. This property determines the price delta value, which is used to aggregate candle ticks, and the tick size of the associated Y axis (price axis).
For example, if the TickSize is set to 0.5 and the visible range of the associated price axis is 28.9-49.8, the price levels (price axis major ticks) will be 28.5, 29, 29.5, 30, …, 49.5, 50. The number of prices for each candlestick is determined by these levels and the Low and High price values of the candlestick. Subsequently, the accumulated Ask and Bid volumes are calculated for each candlestick price level using the collection of ITick objects from the CandlestickMetaData of the corresponding candlestick.
The TickSize property can be set directly on the MarketProfileSeriesHelper instance or accessed through the FastHistoBarRenderableSeries.TickSize mirrored property.
| Setting the Tick Size |
Copy Code |
|---|---|
<s:FastHistoBarRenderableSeries ShowCandlesticks="True" MaxHistoBarCandles="30" TickSize="0.5"/> | |